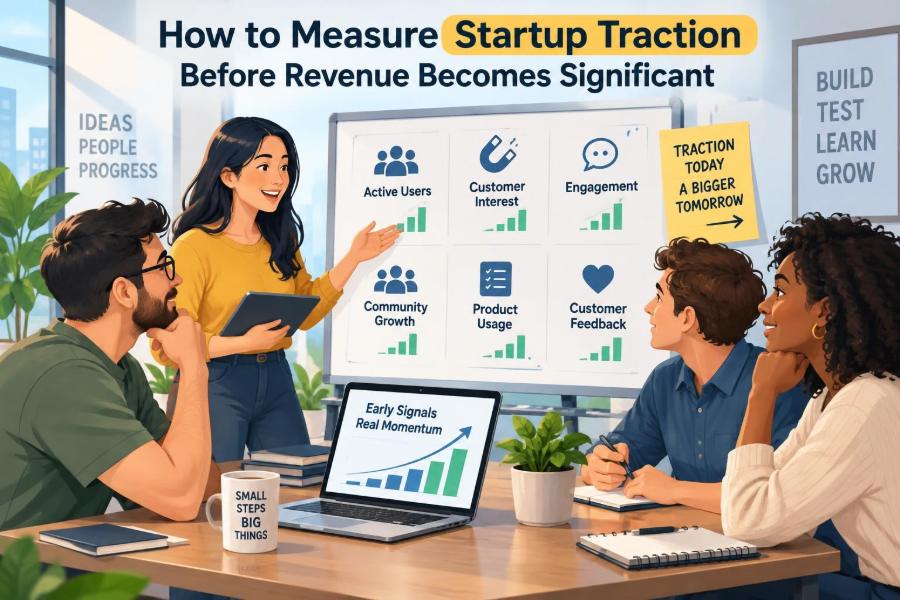

Early startup traction is easy to misunderstand. If your revenue is still small, irregular, or nonexistent, it can feel as though you have no evidence that the business is working.
But revenue is a lagging signal. Before it arrives in meaningful amounts, customers leave clues through their behavior: they return, invite colleagues, complete an important task, tolerate a rough prototype, or agree to pay when your product is ready.
This matters most for founders building software, marketplaces, services, consumer products, and side projects with a long sales cycle. It also matters for small-business owners testing a new offer before investing heavily in staff, inventory, or advertising.
The opportunity is to replace vague optimism with a simple evidence system. You do not need a giant dashboard; you need a few honest measures that show whether a specific group of people is moving closer to becoming loyal customers.
🧭 1. Start With a Useful Definition of Traction
Traction is repeated customer behavior that suggests your business is solving a meaningful problem. It is not a press mention, a large social following, an accelerator badge, or a one-time spike in sign-ups.
For an early-stage company, traction can show up before substantial revenue in several forms:
- People consistently reach the product’s core outcome.
- Users return without being personally chased.
- Customers make introductions or invite teammates.
- Prospects accept a paid pilot, deposit, or letter of intent.
- Your cost and effort to acquire or serve customers start becoming repeatable.
The word repeated matters. One enthusiastic customer is encouragement. Similar behavior from a growing set of well-matched customers is evidence.
🎯 2. Define the Customer and Job Before Measuring Anything
A metric is only useful when it belongs to a clear customer segment and a specific job they are trying to do. “Small businesses” and “saving time” are too broad to guide decisions.
Write a narrow starting hypothesis
Use this sentence: We help [specific customer] accomplish [important job] when [triggering situation] occurs.
For example: “We help independent bookkeepers collect missing client documents when month-end reconciliation begins.” This is much more measurable than “an AI tool for finance.”
- Specific customer: independent bookkeepers with 20 to 80 monthly clients.
- Important job: collect documents without repeated follow-up.
- Trigger: month-end close.
- Desired outcome: files arrive faster and reconciliations finish sooner.
Measure traction within one initial segment first. Combining students, enterprises, hobbyists, and agencies into one dashboard can hide the fact that only one group truly cares.
⭐ 3. Identify Your Product’s “Aha” Moment
The aha moment is the action or outcome after which a person is much more likely to understand the product’s value and return. It is usually not creating an account.
For a scheduling tool, it may be booking the first meeting without back-and-forth emails. For a local meal-prep business, it may be receiving a first order that is convenient enough to replace a stressful grocery trip.
Find it step by step
- List the five to eight actions from first visit to customer outcome.
- Talk to recent users and ask when the product “clicked.”
- Compare users who returned with those who disappeared.
- Choose one behavior that represents real value, not a vanity action.
- Track the percentage of new users who reach it.
Call this your activation event. If you cannot describe it plainly, your product may still be solving too many problems at once.
📊 4. Build a Minimum Viable Traction Dashboard
A founder can learn a lot from a spreadsheet updated once a week. Start there before buying complex analytics software or debating dozens of charts.
| Metric | What it reveals | Early question to ask |
|---|---|---|
| Qualified leads | Demand from the right audience | Are the people responding a real fit? |
| Activation rate | Initial value delivery | Do new users reach the aha moment? |
| Retention | Ongoing usefulness | Do they come back when the need returns? |
| Referral or invite rate | Strength of perceived value | Would users put their reputation behind it? |
| Paid intent | Commercial potential | Will a buyer commit money or time? |
| Service effort | Operational viability | Can you deliver value repeatedly? |
Track the date, customer segment, source, and a short note for every meaningful conversation. Numbers tell you what happened; notes often explain why.
👥 5. Measure Qualified Demand, Not Raw Attention
Traffic can be useful, but it is weak proof on its own. A viral post can attract thousands of people who will never buy, while ten conversations with ideal buyers can change your business.
Define a qualified lead as someone who matches your target segment and demonstrates a relevant need. Their signal might be booking a discovery call, submitting a detailed request, joining a pilot, or asking about implementation.
Simple weekly lead review
- How many people entered from each channel?
- What percentage fit your target profile?
- What problem did they describe in their own words?
- Did they take a high-intent next step?
- Which source produced the best-fit conversations?
A small, consistent pipeline of qualified interest is more actionable than a large audience with no urgency.
⚡ 6. Track Activation as a Funnel, Not a Feeling
Founders often say users “love it” while a large share never reaches value. Activation makes the gap visible.
Map the smallest path to the aha moment. A B2B workflow product might have: create account, connect data source, invite teammate, complete first workflow. A service business might have: inquire, receive proposal, book, complete first service.
Example activation calculation
If 40 qualified trial users start in a month and 18 complete the first useful workflow, activation is 18 divided by 40, or 45%. Do not obsess over a universal benchmark; compare your own cohorts after you improve onboarding.
When activation is low, watch users, ask them to narrate their screen, or personally guide a few through the flow. The obstacle may be unclear language, missing trust, setup work, or simply the wrong audience.
🔁 7. Use Cohort Retention to See Whether Value Lasts
Retention asks whether customers return after their first experience. It is often the clearest early indicator of product-market fit because it measures behavior rather than polite feedback.
Group people by the week or month they first activated. Then check how many from each group return to do the core action in later periods.
Choose a retention window that matches the product
- Daily tools: measure next-day and weekly return.
- Weekly workflow tools: measure weekly return.
- Monthly financial or reporting products: measure monthly return.
- Event-based services: measure return at the next natural buying occasion.
A tax-preparation service should not expect daily activity. A team communication tool probably should. Context matters more than copying another startup’s metric.
Also distinguish between product retention and relationship retention. A high-touch consulting client may not log into software often but may renew, refer others, and request additional work.
🧪 8. Run Small Experiments With One Clear Question
Early traction improves through learning cycles, not grand launches. Each experiment should test one uncertain assumption that could change your next decision.
A practical experiment format
- Hypothesis: Bookkeepers will connect a client portal if it reduces follow-up messages.
- Change: Replace generic onboarding text with a “collect documents in one request” setup flow.
- Success signal: More new users send a first request within seven days.
- Time frame: Two weeks or a predetermined number of qualified users.
- Decision: keep, revise, or stop based on the result.
Avoid changing pricing, audience, onboarding, landing-page copy, and product features all at once. If the number moves, you will not know what caused it.
💬 9. Treat Customer Interviews as Measurement
Qualitative evidence is not a substitute for behavior, but it helps you interpret behavior correctly. Ten thoughtful conversations with people who recently acted can reveal more than a generic survey sent to strangers.
Interview users after a real event: completing onboarding, canceling, renewing, referring, or declining a proposal. Ask about their past behavior rather than imagined future behavior.
Questions that produce useful evidence
- What did you do before trying this?
- What made this problem urgent enough to address now?
- What part was confusing, slow, or disappointing?
- What happened after you used it?
- What would you use instead if this disappeared tomorrow?
- Who else experiences the same problem?
Be careful with “Would you pay?” People often want to be supportive. A stronger signal is a deposit, a pilot agreement, time spent on implementation, or a specific procurement step.
💳 10. Measure Willingness to Pay Before Revenue Is Large
Meaningful revenue may take time because of long contracts, procurement, seasonality, or product development. You can still test whether buyers see enough value to commit.
Paid intent ranges from weak to strong. A mailing-list signup is weak. A signed pilot with a defined budget is stronger. A payment or non-refundable deposit is stronger still.
| Signal | Strength | What to learn |
|---|---|---|
| Survey response | Low | Language and broad interest |
| Demo request | Moderate | Problem curiosity and fit |
| Detailed pilot discussion | Moderate to high | Buying process and objections |
| Letter of intent | High, with limits | Potential demand if terms are specific |
| Deposit or paid pilot | Very high | Real economic commitment |
Be transparent about what exists today and what is planned. Do not take money for a promise you cannot realistically deliver, and follow applicable consumer, tax, refund, and contract rules in your country.
🤝 11. Watch Referrals, Invites, and Organic Pull
When users invite another person, they are spending social capital. That makes referrals an especially valuable signal, provided the invite is voluntary and relevant.
For collaborative products, track invites per activated account and the percentage of invited people who activate. For a local business, track referrals, repeat word-of-mouth mentions, and customers who bring a friend.
Ask for referrals without manufacturing them
First deliver an outcome. Then ask a simple question: “Is there one person who has this same problem and would benefit from seeing this?”
Do not bribe early users into low-quality referrals just to improve a dashboard. A referral program can scale later; genuine customer enthusiasm is the signal you want now.
🛠️ 12. Measure the Manual Work Behind the Magic
Some of the best early startups deliver their first results manually. That is not failure. It is a way to learn the workflow before automating it.
However, manual delivery must be measured. Track the minutes, people, software, and exceptions required for each successful customer outcome.
Track these operational metrics
- Hours required per new customer.
- Time from request to delivered outcome.
- Number of manual handoffs.
- Common errors and rework.
- Customer satisfaction after delivery.
- Which steps repeat predictably enough to automate.
If customers are delighted but every account requires ten hours of founder labor, you have evidence of demand, not yet a scalable business. That distinction protects you from scaling a painful process too early.
📈 13. Look for Trend Quality, Not Just Big Numbers
Early datasets are noisy. A few users leaving can make a percentage collapse; one large customer can make growth look spectacular. Focus on the direction, consistency, and explanation behind the trend.
Useful questions include:
- Are more qualified people activating each week or month?
- Is the same customer segment improving, or did the mix change?
- Are returning users completing the core action more often?
- Are referrals appearing without constant prompting?
- Is delivery becoming faster or less founder-dependent?
Use absolute counts alongside percentages. “Retention increased from 20% to 40%” sounds dramatic, but it means something different if the cohort grew from five people to ten versus 500 people to 1,000.
🧮 14. Calculate Basic Unit Economics Early, With Humility
You do not need a perfect financial model before finding traction. You do need a rough sense of whether a customer can eventually be served profitably.
Estimate your contribution margin: revenue from a customer minus direct costs to acquire, onboard, fulfill, support, and retain that customer. Separate these from fixed costs such as your own general software subscriptions.
Keep the first model simple
- Expected price or recurring fee.
- Direct labor per customer.
- Materials, shipping, payment processing, or third-party usage costs.
- Marketing spend tied to acquisition.
- Likely refund, churn, or support burden.
These are estimates, not promises. Labor rates, taxes, payment fees, import duties, data rules, and employment regulations vary by country and business model. Update assumptions as real transactions arrive.
🚫 15. Learn to Spot Vanity Metrics
Vanity metrics look impressive but do not reliably predict customer value or a sustainable business. They can still be useful for awareness campaigns, but they should not drive core decisions.
Common examples
- Total sign-ups when most never activate.
- Social followers without qualified conversations or traffic.
- App downloads without repeat usage.
- Email opens without clicks, replies, or purchases.
- Press coverage without a relevant customer pipeline.
- Total users when inactive accounts dominate the count.
Replace each vanity metric with a behavioral companion. Instead of total downloads, track the percentage that completes the first valuable task and returns in the relevant period.
🧱 16. Avoid the Most Common Measurement Mistakes
Metrics can mislead even well-intentioned founders. Most errors come from measuring too broadly, too late, or without understanding the customer journey.
- Measuring everyone together: segment by customer type, acquisition source, and use case.
- Counting accounts instead of people: one company may create many test accounts.
- Ignoring seasonality: some needs naturally rise and fall during the year.
- Optimizing the easiest metric: cheap sign-ups may reduce lead quality.
- Calling interest traction: separate compliments from commitments.
- Waiting for perfect data: use a spreadsheet and customer notes now.
- Overreacting to one week: seek a repeated pattern before rebuilding everything.
Privacy matters too. Collect only the customer data you need, explain how you use it, secure it appropriately, and comply with the applicable privacy and marketing rules where you operate.
🗓️ 17. Create a Weekly Founder Traction Review
A regular review prevents the business from becoming a collection of disconnected tasks. Reserve 30 to 60 minutes each week to inspect evidence and choose the next experiment.
Use this agenda
- Review qualified leads, activation, retention, referrals, and paid intent.
- Compare this week’s cohort with prior cohorts.
- Read customer notes and support requests for recurring language.
- Identify the biggest bottleneck in the path to value.
- Choose one experiment with one success measure.
- Write down what would make you continue, change, or stop.
Share this document with co-founders or advisors, but do not use meetings to defend a favorite idea. The purpose is to make the next customer-facing action clearer.
🧭 18. Know When the Evidence Is Strong Enough to Invest More
There is no universal threshold at which a startup is “proven.” The appropriate bar depends on your risk, cash reserves, market, and model. A regulated healthcare product needs more validation than a simple local service test.
Still, stronger traction usually looks like several signals pointing in the same direction: a defined group activates, returns at the natural usage interval, expresses real willingness to pay, and can be served through a process that is gradually becoming more repeatable.
Increase investment carefully when you can say:
- We know which customers respond best and why.
- We can describe the aha moment and improve the path to it.
- Customers return, renew, refer, or deepen use for understandable reasons.
- We have tested a credible route to payment.
- We know the main operational constraint before adding volume.
That may justify spending more on product, inventory, sales, or a first hire. It does not eliminate risk; it means you are taking the next risk with better information.
✅ 19. Your Action Plan for This Week
Do not wait for a polished analytics setup. Turn your current uncertainty into a small measurement system.
- Write one sentence defining your initial customer, job, trigger, and outcome.
- Choose one activation event that proves a customer received value.
- Create a simple spreadsheet with leads, activation, return behavior, referrals, paid intent, and manual effort.
- Contact five recent users or prospects and ask about real behavior, not hypothetical preferences.
- Review where people drop off and run one focused experiment next week.
- Record what you learned, including results that challenge your assumptions.
You are not trying to impress investors, competitors, or social media. You are trying to earn the right to keep building by understanding whether customers are pulling the business forward.
Before revenue becomes significant, the most valuable traction is clear evidence that the right customers repeatedly reach value and move closer to commitment. Measure that honestly, improve one bottleneck at a time, and let real behavior guide your next move. 🚀📈🤝