
A startup can look busy long before it becomes healthy. New signups, orders, and conversations feel encouraging, but they do not tell you whether your customer acquisition can actually support the business.
Customer lifetime value (CLV or LTV) gives you a more useful question: after serving a customer, supporting them, and keeping them around, what is that relationship worth to your company? It is one of the clearest ways to decide what you can afford to spend to grow.
This matters especially for founders selling subscriptions, repeat purchases, retainers, memberships, marketplaces, and services with recurring needs. It also matters for one-time-purchase businesses, because repeat orders, referrals, upgrades, and margins can turn a seemingly modest sale into a valuable customer relationship.
You do not need perfect data or a finance team to begin. You need a sensible model, clear assumptions, and the discipline to update it as real customer behavior replaces your guesses.
🧭 1. Start with the real question CLV answers
CLV estimates the gross profit or revenue a typical customer generates over their relationship with you. The most practical version for an early startup is usually gross-profit CLV, because revenue alone can make a low-margin business look much stronger than it is.
Use CLV to make decisions such as:
- How much can we spend to acquire one customer?
- Should we offer a discount, free trial, onboarding call, or referral reward?
- Which customer segment deserves more attention?
- Is churn the urgent problem, or do we need higher prices?
- Can we hire sales help without putting cash flow at risk?
It is not a promise of future earnings. It is a decision-making estimate. Treat it as a range that becomes more reliable over time.
🧮 2. Learn the simple formulas before building a spreadsheet
For a business with a repeat purchase pattern, a basic model is:
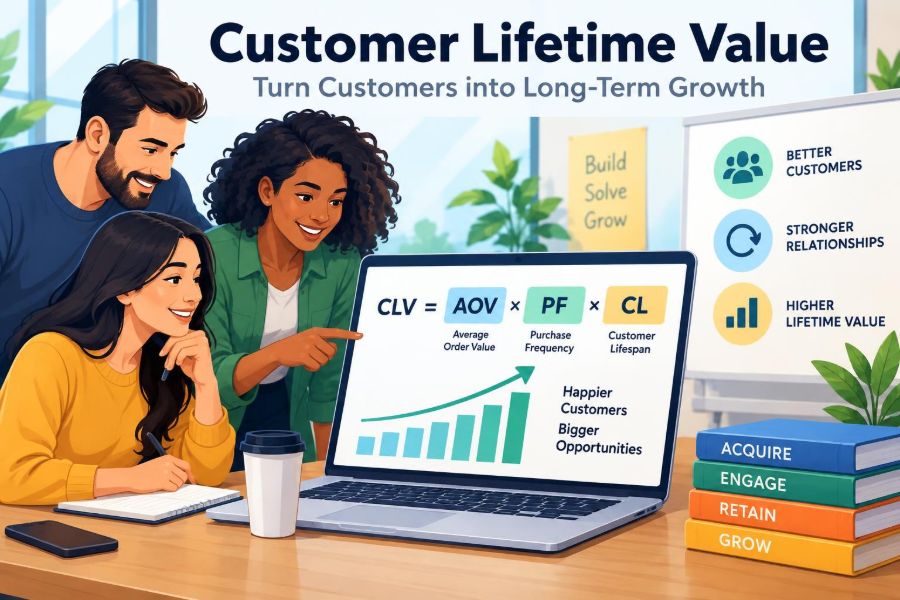
CLV = Average order value × Purchase frequency × Average customer lifespan
For a subscription business, the common shortcut is:
CLV = Average monthly revenue per customer ÷ Monthly churn rate
To make either formula more useful, account for gross margin:
Gross-profit CLV = Revenue CLV × Gross margin percentage
If average monthly revenue is $50, monthly churn is 5%, and gross margin is 80%, the rough estimate is $50 ÷ 0.05 × 0.80 = $800. That is an estimate, not a budget you should immediately spend on advertising.
📏 3. Choose the CLV definition that fits your stage
There is no single universally correct CLV number. A founder should choose the simplest definition that supports the decision in front of them.
| Approach | Best for | Effort | Watch out for |
|---|---|---|---|
| Historical CLV | Businesses with completed customer histories | Low to medium | May not reflect recent changes |
| Predictive CLV | Businesses with enough cohort data | High | Can create false precision |
| Revenue CLV | Quick early-stage planning | Low | Ignores delivery costs |
| Gross-profit CLV | Pricing and acquisition decisions | Medium | Requires honest cost estimates |
Early on, calculate revenue CLV and gross-profit CLV side by side. The gap is often the wake-up call that improves a pricing or fulfillment decision.
🧱 4. Define a customer before doing the math
Your calculation is only as clean as your definition of “customer.” A $9 monthly self-serve subscriber and a $2,000 annual client using onboarding support should not be blended into one average.
Split customers when their behavior, costs, or retention are meaningfully different. Useful starting segments include:
- Monthly versus annual subscribers
- Consumers versus business accounts
- Self-serve customers versus sales-led customers
- One-time buyers versus repeat buyers
- Customers acquired through paid ads, partnerships, referrals, or organic search
Do not over-segment at first. Two or three clear groups beat twenty tiny groups with unreliable data.
💵 5. Calculate average revenue carefully
For a subscription product, use the revenue actually collected per active customer in a period. Include recurring plan fees and predictable add-ons, but separate one-off implementation work if it distorts the core subscription picture.
For a shop or service business, calculate:
Average order value = Total sales revenue ÷ Number of orders
Then calculate how many orders the average customer makes in a month, quarter, or year. If your records cannot match orders to individuals yet, fixing that tracking is a priority, not an optional analytics project.
Practical example
A specialty stationery store has $12,000 in quarterly sales from 400 orders. Its average order value is $30. If 250 unique customers placed those orders, purchase frequency is 1.6 orders per customer per quarter. That is more informative than revenue alone.
📦 6. Use gross margin, not wishful thinking
Gross margin is what remains after the direct costs of delivering the sale. For physical products, this often includes product cost, packaging, payment processing, fulfillment, shipping subsidies, and returns. For software, it can include hosting, third-party usage fees, support directly tied to accounts, and onboarding labor.
Gross margin = (Revenue − Direct costs) ÷ Revenue
Marketing, founder salary, rent, and general software tools are important operating expenses, but they are usually not included in gross margin. Keep definitions consistent so your comparisons remain useful.
Be especially cautious with “free shipping,” heavy service, and generous refunds. These may win customers while quietly reducing the value of each one.
🔄 7. Measure retention before guessing lifespan
Lifespan is often the weakest assumption in an early CLV model. Instead of declaring that customers will stay for three years, begin measuring what proportion remain active over time.
For subscriptions:
Monthly churn rate = Customers lost during month ÷ Customers at start of month
If you started with 100 paying customers and 4 canceled, monthly customer churn is 4%. Be careful to distinguish customer churn from revenue churn; losing one large account can make revenue churn much higher.
For repeat-purchase businesses, track repurchase windows: what percentage purchases again within 30, 60, 90, or 180 days? The right window depends on the natural buying cycle of your product.
🗓️ 8. Build a cohort table instead of trusting one average
A cohort is a group of customers who started in the same period or came through the same channel. Cohorts show whether newer customers are behaving differently from older ones.
Create a basic table with acquisition month in each row and months since signup across the columns. For every cell, record active customers, revenue per original customer, or retention percentage.
- January customers: how many were active after one, two, and three months?
- February customers: did the same pattern improve?
- Referral customers: do they stay longer than paid-social customers?
This prevents a common mistake: using last year’s loyal early adopters to justify this year’s expensive acquisition channel.
🎯 9. Pair CLV with customer acquisition cost
CLV becomes powerful when compared with customer acquisition cost (CAC). CAC is the sales and marketing spend needed to gain a new customer over a defined period.
CAC = Sales and marketing spend ÷ New customers acquired
Include advertising, agency costs, commissions, relevant tools, and the proportion of salaries directly spent acquiring customers. Do not count every company expense as CAC, but do not pretend founder time is free forever either.
A simple ratio is:
CLV:CAC = Gross-profit CLV ÷ CAC
A larger ratio is generally healthier, but no universal target fits every model. Growth stage, gross margin, cash reserves, payback speed, and retention confidence all matter.
⏱️ 10. Track CAC payback because cash arrives late
A customer can have attractive lifetime value and still strain the business if you pay to acquire them today but recover the cost slowly. This is why CAC payback period deserves a place beside your CLV calculation.
CAC payback months = CAC ÷ Monthly gross profit per customer
If CAC is $240 and monthly gross profit is $40, payback is about six months. That may be manageable for a bootstrapped software business with annual prepayment, but difficult for a low-cash company funding ads from monthly receipts.
Ask whether your cash balance can survive your payback period, especially after taxes, refunds, payroll, and inventory commitments. Requirements and tax treatment vary by country, so confirm local obligations with a qualified adviser.
🧪 11. Make assumptions visible in your first model
When you lack history, create a simple assumption-based model. The goal is not to impress an investor with a huge number; it is to identify the few assumptions that could make the business unworkable.
A starter spreadsheet should include
- Plan or product price
- Average orders or monthly revenue per customer
- Direct cost per order or account
- Gross margin
- Estimated repurchase rate or monthly churn
- Estimated lifespan
- CAC by channel
- CAC payback period
Label every unverified input as an assumption. Then write the cheapest test that could validate or disprove it.
🔍 12. Run a conservative, base, and upside scenario
One CLV number encourages overconfidence. Three scenarios create better decisions.
| Scenario | What changes | How to use it |
|---|---|---|
| Conservative | Lower margin, weaker retention, higher CAC | Check survival and cash needs |
| Base case | Most likely current assumptions | Plan the next quarter |
| Upside | Better retention, upgrades, referrals | Identify what success requires |
For example, do not merely hope churn falls from 8% to 4%. Identify the behavior that would cause it: better onboarding, a more reliable product, annual plans, a narrower target customer, or faster support.
🧲 13. Improve CLV through retention first
Founders often rush to increase traffic when the more durable opportunity is helping current customers succeed. A customer who does not achieve the promised outcome has little reason to renew or return.
Step-by-step retention work
- Identify the first meaningful outcome a new customer should reach.
- Measure how many reach it in their first days or weeks.
- Interview recent cancellations and quiet customers, not only loyal fans.
- Remove one major point of friction in onboarding or delivery.
- Review retention by cohort after the change.
Do not assume a retention tactic worked because customers liked it. Look for changes in activation, repeat purchase, cancellation, support volume, and margin.
📈 14. Raise value with pricing and expansion, carefully
Higher CLV does not always require more customers. A clearer offer, better packaging, sensible price increase, premium tier, cross-sell, or annual plan can improve revenue per customer.
But additional revenue only helps if it preserves trust and margin. A confusing upsell, forced bundle, or poorly designed annual discount can create refunds and churn.
- Test a higher-priced tier for customers with a real advanced need.
- Offer an annual option only when customers receive meaningful value.
- Bundle complementary products that reduce effort for the buyer.
- Review expansion revenue separately from new-customer revenue.
Communicate pricing honestly. Consumer protection, subscription renewal, refund, and tax rules differ by location and business type.
🚫 15. Avoid the most common CLV mistakes
The biggest error is treating a model as a fact. CLV is a directional estimate built from data and assumptions, and it should change when customer behavior changes.
- Using revenue instead of gross profit: this hides expensive fulfillment or support.
- Using tiny samples: ten customers cannot reliably predict a multi-year lifespan.
- Ignoring refunds and failed payments: booked revenue is not always retained revenue.
- Blending unlike customers: enterprise and self-serve behavior can cancel each other out.
- Counting every signup: free users and low-intent trial users may not be customers.
- Optimizing only CAC: cheap customers who leave quickly are rarely a bargain.
- Spending against lifetime value immediately: cash flow and payback still matter.
🛠️ 16. Build the first dashboard with tools you already have
You can begin with a spreadsheet and export data from your payment processor, store platform, CRM, booking system, or accounting software. Do not delay measurement while searching for a perfect analytics stack.
Weekly dashboard
- New paying customers
- New customer CAC by major channel
- Average order value or monthly revenue per account
- Refunds, cancellations, and failed payments
- Gross margin estimate
Monthly dashboard
- Logo or customer churn
- Revenue churn and expansion revenue where relevant
- Retention by cohort
- Gross-profit CLV estimate by segment
- CAC payback period
Automate later, after you know which measures change decisions. A manually updated dashboard can teach a founder more than an elaborate report nobody reviews.
🗣️ 17. Use customer conversations to explain the numbers
Metrics show what happened; conversations often reveal why. Speak with customers who renewed, expanded, stopped using the product, requested refunds, and never completed onboarding.
Ask open questions: What were you trying to accomplish? What almost stopped you from buying? When did you first see value? What would make you leave? Avoid leading them toward the answer you want.
Record patterns, then compare them with cohort data. If high-retention customers share a use case, company size, or acquisition source, that may be a more valuable insight than a small change to an ad campaign.
⚖️ 18. Know when a low CLV is acceptable
A low CLV is not automatically a bad business. A neighborhood service, seasonal product, or simple impulse purchase can work with fast payback, strong local demand, good margins, and low acquisition costs.
Likewise, a high CLV can be dangerous if customers take a year to pay back acquisition spending, require heavy support, or concentrate revenue in a few fragile accounts. Context matters.
The objective is not to maximize a spreadsheet number. It is to build a repeatable model in which customers receive enough value to return and the company earns enough margin to serve them well.
🧭 19. Turn your CLV estimate into a decision rule
Choose a few operating rules that protect the business. For example, pause an acquisition channel when its recent CAC rises above a conservative level, or do not add a discount unless the expected payback still works under your conservative scenario.
Write these rules down before excitement, competition, or a flattering growth chart pressures you into exceptions. Revisit them monthly as your data matures.
Useful questions for every growth experiment include:
- Which segment will this attract?
- What is our expected gross-profit CLV for that segment?
- When do we recover acquisition cost?
- What behavior will tell us the hypothesis was wrong?
- What customer experience cost are we adding?
✅ 20. Your action plan for this week
- Pick one primary customer segment and define exactly who is included.
- Pull the last three to six months of orders, subscriptions, cancellations, refunds, and direct delivery costs.
- Calculate average revenue, gross margin, repeat rate or churn, and a rough gross-profit CLV.
- Calculate CAC for your largest acquisition channel and estimate payback.
- Create conservative, base, and upside scenarios in one spreadsheet.
- Contact five recent customers or former customers to understand the behavior behind the data.
- Choose one retention or margin improvement to test next week.
The best CLV model is not the fanciest one; it is the one that helps you spend more wisely, serve customers better, and learn before cash runs out. 🚀📊🤝